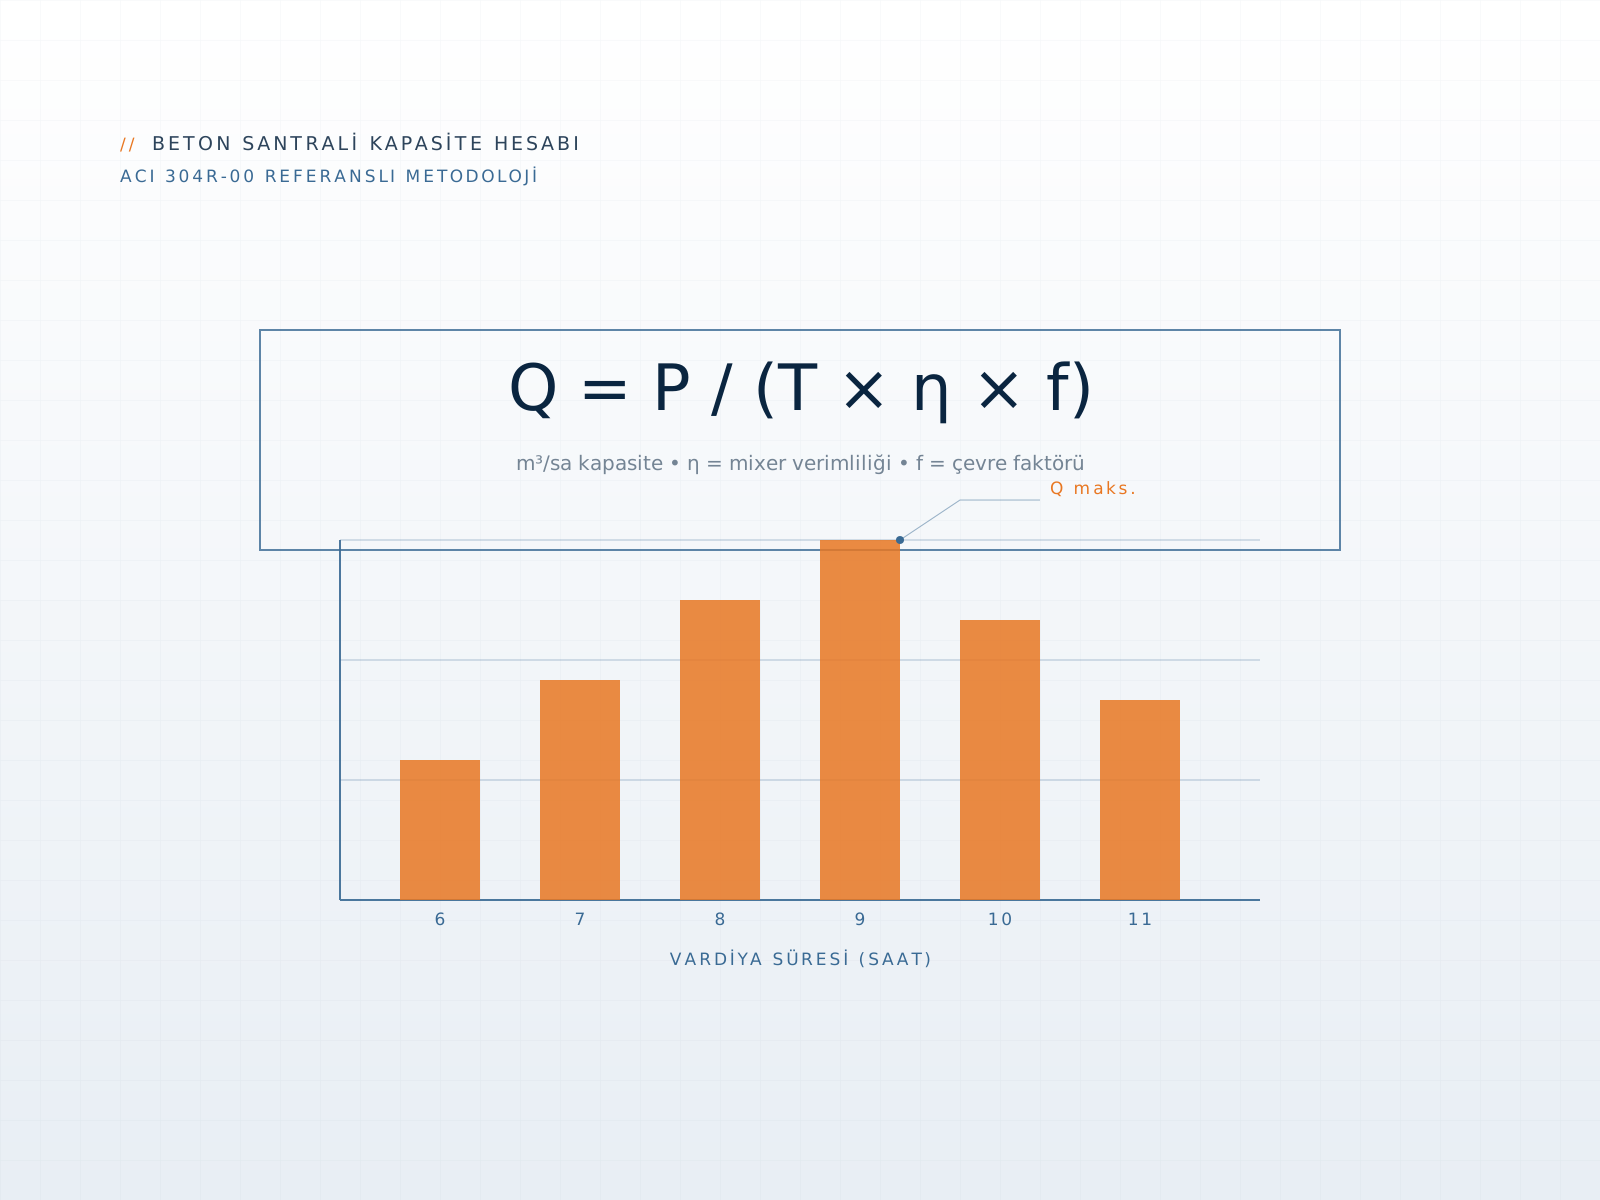
The most critical technical step in a concrete plant investment decision is correctly sizing capacity based on a realistic analysis of the project's concrete demand. An oversized plant ties up unnecessary capital; an undersized one creates serious risk to the project schedule. This article walks through an industry-standard capacity calculation methodology, step by step, with practical worked examples.
The Core Capacity Formula
T = Daily operating hours (h) | η = Mixer efficiency (0–1) | f = Environmental factor (0–1)
Calibrating each variable correctly is critical to getting a reliable result from the formula. Theoretical capacity figures don't reflect real operating conditions — the η and f factors bridge that gap.
Step 1: Determine the Daily Production Target
P (daily production target) is derived directly from the project schedule:
- Divide total concrete volume (m³) by the project duration (days)
- Account for any concentration periods tied to critical-path activities
- Exclude weekends and religious/national holidays from the working-day count
Example: 24,000 m³ of building-frame concrete over a 120-working-day schedule → P = 200 m³/day
Step 2: Mixer Efficiency (η)
Mixer efficiency expresses actual production output against the theoretical cycle time. The Vorqa standard value is η = 0.82. This ratio accounts for the following losses:
- Loading and discharge cycle delay
- Calibration and weighing process
- Short stoppages (material changeover, truck waiting time)
Step 3: Environmental Factor (f)
The environmental factor reflects climate conditions, altitude and site-specific characteristics:
| Condition | f Value | Notes |
|---|---|---|
| Normal conditions (<800m, temperate climate) | 0.95–1.00 | Reference conditions |
| Hot climate (>35°C, high humidity) | 0.88–0.93 | Water/ice requirement, longer mixing |
| High altitude (1,000–2,000m) | 0.90–0.95 | Engine power loss |
| Cold climate (<5°C) | 0.85–0.90 | Aggregate heating, heated water requirement |
| Desert / sandstorm exposure | 0.80–0.87 | Increased equipment maintenance frequency |
Step 4: Apply the Formula
500 m³/day production target, 8-hour shift, η = 0.82 (Vorqa standard), f = 0.95 (normal conditions)
Q = 500 / (8 × 0.82 × 0.95) = 80.3 m³/h
Based on this calculation, a plant with a minimum nominal capacity of 90 m³/h is recommended — adding a 10–15% safety margin for loading gaps and maintenance reserve is best practice.
Step 5: Consider the Number of Shifts
If the production target can't be met with a single shift, two alternatives are a double shift or two smaller-capacity plants running in parallel:
- Double-shift option: complicates the maintenance window and increases dependency on skilled operators
- Two parallel plants: operation continues if one plant goes down, but investment cost increases
Step 6: Verify Aggregate Stock and Silo Capacity
Once plant capacity is calculated, material flow must be verified:
- Silo capacity: must cover at least two shifts' worth of cement demand
- Aggregate bins: must hold at least 4–6 hours of stock at peak production
- Water tank: must contain enough volume for at least one hour of nominal production
Vorqa Global applies this methodology in sizing work for hot-climate projects across Saudi Arabia, Algeria and the Middle East. Desert-climate projects use a regional coefficient of f = 0.82; capacity is safeguarded with additional infrastructure such as heated water lines and shaded aggregate bins.
// References
ACI 304R-00. Guide for Measuring, Mixing, Transporting, and Placing Concrete. American Concrete Institute.
ERMCO. European Ready Mixed Concrete Organization — Production and Delivery Statistics 2024. ERMCO, Brussels.
Turkish Ready Mixed Concrete Association (THBB). Ready-Mix Concrete Sector Data Report 2024. THBB, Istanbul.
Neville, A.M. & Brooks, J.J. Concrete Technology, 2nd Edition. Pearson Education, 2010.

Let's talk about your project.
Our expert team is ready to hear your technical requirements.